
Research notes · Peptide stability
Retatrutide stability research offers useful clues about how storage conditions affect a peptide over time. Exploring the laboratory findings helps make the science of handling and preservation easier to understand.
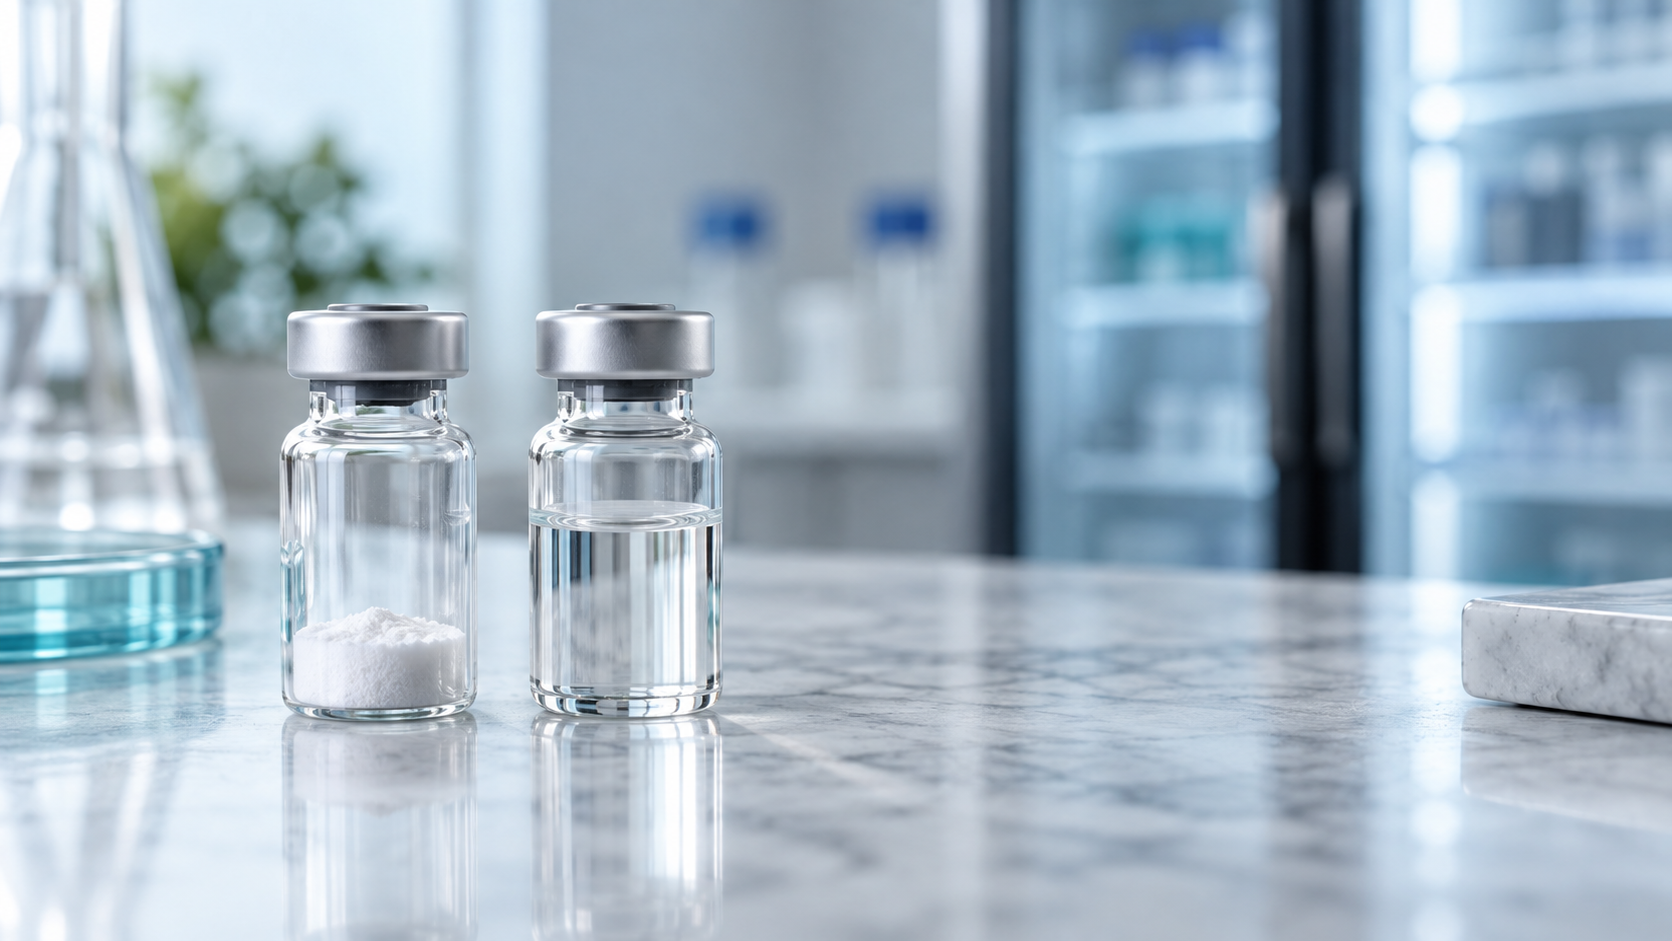
How long does retatrutide remain stable? The answer depends on what is being measured. A vial can show high analytical purity while less material is recovered. A dry sample and a dissolved sample also present different questions.
Eight small laboratory studies examined storage under several conditions. They offer preliminary observations—not a validated expiration date or a safe period for human use.
The storage results at a glance
Percentage changes below use the reported mass measurements relative to each sample’s starting value. Purity is shown separately where relevant.
| Condition | Reported observation |
|---|---|
| Refrigerated solution | Two samples lost about 9.0% and 9.6% of mass over 90 days; purity remained around 99.6%. |
| Different diluents | At 90 days refrigerated, mass fell about 2.5% with bacteriostatic water and 8.2% with ultrapure water. |
| Room-temperature solution | Two samples lost about 1.6% and 8.7% of mass over 45 days. |
| Freezing and thawing | Two samples lost about 14.4% and 13.4% of mass over 45 days. |
| Refrigerated outlier | One sample lost about 44.3% of mass; purity fell from 98.2% to 57.0% over 90 days. |
| Long-term dry storage | Three samples showed little change in measured purity after approximately 14–21 months. |
| Heated dry powder | At approximately 54.4°C, purity fell from 96.958% to 93.672% over 21 days, with little mass change. |
Why “99% pure” is not a complete answer
Imagine comparing two measurements from the same vial: the fraction of the analysed material identified as the target compound, and the quantity recovered. The first can remain high even while the second falls.
The testing summary describes filtration before analysis, which can remove insoluble material. A purity reading may therefore describe only the material that passed through the filter.
This is why purity and recovered quantity belong side by side. Reduced recovery does not, on its own, identify whether the cause was degradation, aggregation, material sticking to the container, or analytical variation. Separating those possibilities requires additional testing.
How much can these comparisons tell us?
Diluent: an observation worth following up
A comparison with one vial per condition cannot establish a general advantage for a diluent. It cannot reliably separate a diluent effect from differences between vials. Replicated testing with a defined formulation would make the result more useful.
Temperature: compare like with like
Different products tested over different periods do not establish a universal temperature-dependent degradation rate. A stronger experiment would compare matched samples under controlled temperatures, using the same analytical method and sampling schedule.
The freezing observations raise a question for further study; they do not validate or rule out every freezing protocol. Likewise, the heated-powder results should not be converted into a fixed daily loss rate or a guarantee about shipping conditions.
Outliers: investigate before generalising
An unusually poor result deserves investigation. It should neither be dismissed because other samples performed better nor treated as representative of every vial. A small collection of tests cannot reliably estimate how often a failure occurs.
Chemical stability is not a safe-use deadline
These measurements do not answer whether a solution remains free from microbial contamination. They also do not directly establish biological activity or clinical effectiveness.
A defensible shelf-life claim needs a defined formulation, validated methods, adequate replication, controlled storage and appropriate microbiological testing. The presence of a preservative alone does not supply that evidence.
What to take from the research
The most useful conclusion is a way to read the evidence: check both quantity and purity, look for matched comparisons, and keep the limitations of individual samples in view.
These observations are a starting point for better-controlled stability research. They should not be turned into a blanket statement that retatrutide is safe or suitable for use after a particular number of days.
Study identifiers: 293, 473, 555, 616, 624, 625, 683 and 715. Calculated mass loss = (starting mass − final mass) ÷ starting mass × 100. The supplied “total peptide” column was not used because its values do not consistently match the stated mass × purity calculation. This is an interpretation of supplied measurements, not independent laboratory verification.
Educational research summary. It does not provide dosing or administration instructions.